When a timber buyer evaluates your property, they’re not just looking at trees—they’re running a calculation. They size up diameters, sort your timber into product classes, and estimate what each category is worth today and in the future.
Most landowners never see this math. You get an offer, and you’re left wondering: is this fair? Could I get more if I waited a few years?
Understanding how buyers value timber changes everything. It helps you evaluate offers, time your harvest, and manage your land with a clear financial picture. Here’s the framework they use—and how you can now see it for yourself.
See your timber through a buyer’s eyes
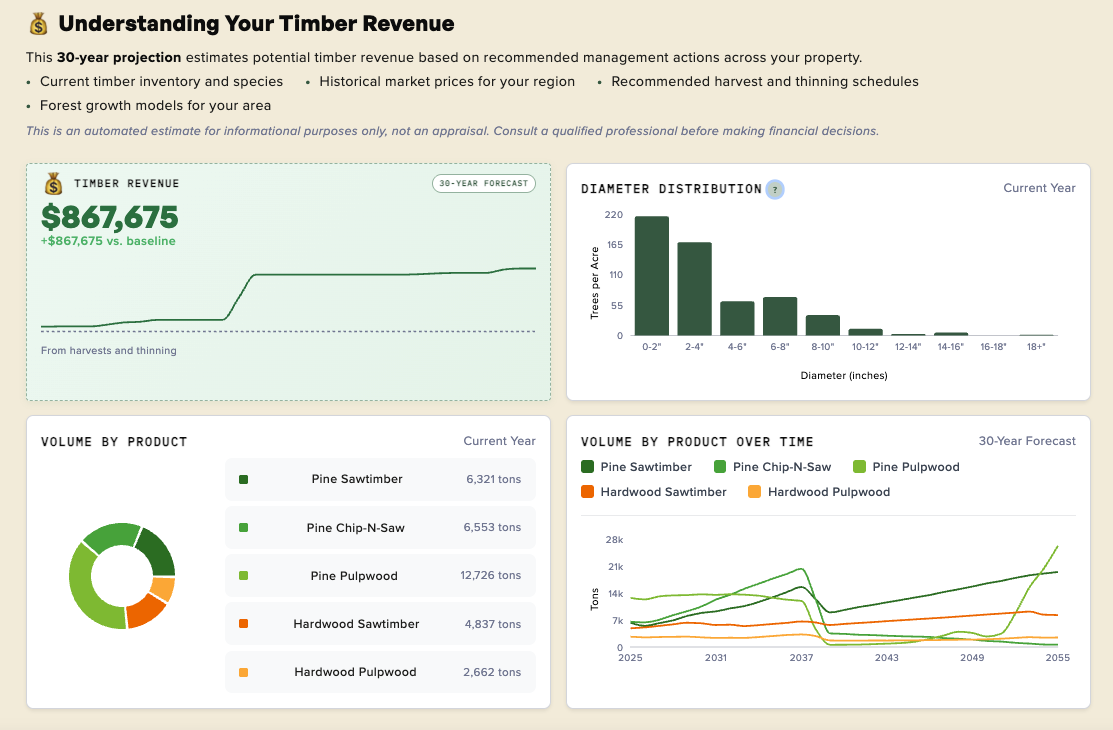
Forest Forecast now shows you exactly what buyers evaluate when they look at your property. Select Timber Revenue as one of your goals, and you’ll see the same factors a buyer considers:
- Diameter distribution: How many trees of each size class you have
- Product mix: What timber products you have today and their relative values
- 30-year projections: How your timber mix is expected to shift over time
To see this view: select Timber Revenue as one of your goals in Forest Forecast, then click the Timber Revenue chart to open the detailed breakdown.
Let’s walk through what each of these means—and why buyers care.
What buyers look at first: tree size
The single biggest factor in timber value is tree size. Larger trees yield higher-grade lumber and command premium prices. But what counts as “large”?
Foresters measure trees by DBH—diameter at breast height, about 4.5 feet above the ground. Here’s a quick reference:
- 5-6 inches (about as big around as a 1-liter soda bottle): Pulpwood size
- 8-12 inches (roughly a dinner plate): Chip-n-saw territory
- 12+ inches (think car tire): Sawtimber—the most valuable category
The diameter distribution chart in Forest Forecast shows how many trees per acre fall into each size class across your property. A forest with lots of trees in the 12”+ range has more immediate timber value. A forest heavy in smaller size classes has growth potential—those trees will graduate into higher value categories over time.
A balanced distribution across size classes often indicates a healthy, well-structured forest with both near-term and long-term value.
Product classes: how mills see your timber
When a mill looks at your trees, they’re thinking about what they can make from them. Different products have very different values, and understanding this breakdown helps you see your forest the way buyers do.
Pine products
Pine Sawtimber $$$ — 12”+ diameter Large logs milled into lumber: 2x4s, framing, flooring, and other dimensional lumber. This is the highest-value pine product.
Pine Chip-n-Saw $$ — 8-12” diameter Mid-sized trees that yield some small lumber plus wood chips for paper production. A transitional product class.
Pine Pulpwood $ — Under 8” diameter Smaller trees chipped entirely for paper, cardboard, and other fiber products. Low value per ton, but often abundant.
Hardwood products
Hardwood Sawtimber $$$ — Large diameter oak, hickory, etc. Premium logs for furniture, cabinets, flooring, and specialty wood products. Species like white oak and black walnut command top prices.
Hardwood Pulpwood $ — Smaller hardwoods Smaller or lower-quality hardwood trees used for specialty paper and biomass energy.
The product volume chart shows your current mix—what percentage of your standing timber falls into each category. If you’re mostly pulpwood today, you know your forest has room to grow. If you’re heavy on sawtimber, you may be in a good position to harvest.
The graduation effect: how value compounds
Here’s the insight that changes how many landowners think about their timber:
As trees grow, they “graduate” from pulpwood to chip-n-saw to sawtimber—roughly doubling in value per ton at each step.
This isn’t just about having more wood. It’s about having more valuable wood. A ton of pine sawtimber might fetch $25-35, while a ton of pulpwood from the same property brings $8-12. Same species, same acre, dramatically different value.
The volume by product over time chart shows this graduation in action. You can watch your timber mix shift over 30 years—pulpwood shrinking as a percentage while sawtimber grows. For many properties, this projection reveals that waiting a few years could meaningfully increase total value, even before accounting for additional growth.
Of course, waiting has trade-offs too. Markets shift, and there’s always risk from storms, fire, or insects. But seeing the projection helps you weigh those decisions with real data.
What this means for your decisions
Understanding your timber at this level of detail helps you answer practical questions:
- Should I harvest now or wait? If most of your trees are just below sawtimber size, a few more years of growth could significantly increase value.
- Is thinning worthwhile? Removing smaller, lower-value trees can accelerate growth in your best stems—moving them up the value ladder faster.
- What’s a fair offer? Knowing your product mix helps you evaluate whether a buyer’s bid makes sense for what you actually have.
For a deeper dive on evaluating timber offers, see our guide: What’s a Fair Price for Your Timber?
See your forest the way buyers do
These timber insights are available now in Forest Forecast. To explore them:
- Log into your NCX account (or create one for free)
- View your Forest Forecast and select your goals—make sure to include Timber Revenue
- Click on the Timber Revenue metric card to see the detailed breakdown
The next time a buyer makes an offer, you’ll know exactly what they’re looking at—and whether their number makes sense.
Want help evaluating an offer or timing your harvest? The NCX Timber team is here to help.
Schedule a Free Timber Consultation
Forest Forecast was funded by a grant from the U.S. Forest Service.